Complete Investment Analysis Framework (Beginner to Advanced) Introduction to Investment Analysis Investment analysis is the systematic evaluation of financial assets to determine their potential return, risk level, and suitability for investment. It helps investors identify profitable opportunities and allocate their capital efficiently.
Investment analysis involves examining multiple factors such as:
Financial performance of companies
Market trends
Economic conditions
Risk factors
Expected returns
By analyzing these elements, investors can make rational decisions instead of relying on speculation.
The primary objectives of investment analysis include:
Identifying investment opportunities
Estimating potential returns
Evaluating risk levels
Comparing different financial assets
Constructing diversified investment portfolios
A well-structured investment analysis helps investors achieve long-term financial goals while managing uncertainty.
Investment analysis can be divided into several approaches.
Fundamental analysis evaluates the intrinsic value of an investment by studying financial and economic factors.
It focuses on:
Company financial statements
Earnings growth
Profit margins
Industry performance
Economic conditions
Example:
If a company has strong revenue growth, increasing profits, and low debt, it may be considered financially strong.
Technical analysis studies historical price movements and trading patterns to predict future price trends.
Technical analysts use:
Price charts
Trading volume
Trend indicators
Chart patterns
This method is often used for short-term trading decisions.
Quantitative analysis uses mathematical models and statistical techniques to evaluate investments.
Examples include:
Financial ratios
Risk models
Portfolio optimization techniques
Institutional investors and hedge funds frequently use quantitative analysis.
Risk and return are the two most important concepts in finance.
Risk refers to the possibility that an investment may produce lower returns than expected or lead to financial loss.
Types of investment risk include:
Market risk
Interest rate risk
Inflation risk
Liquidity risk
Credit risk
Return represents the profit earned from an investment.
There are two main sources of return:
Capital gain – increase in asset price
Income – dividends or interest payments
Example:
If an investor buys a stock at ?100 and sells it at ?130, the capital gain is ?30.
Finance theory suggests that higher risk investments generally offer higher potential returns.
Examples:
| Investment Type | Risk Level | Expected Return |
|---|---|---|
| Government bonds | Low | Low |
| Blue-chip stocks | Medium | Moderate |
| Small-cap stocks | High | High |
Understanding this relationship helps investors choose investments according to their risk tolerance.
Portfolio analysis evaluates a group of investments collectively rather than individually.
A portfolio may include:
Stocks
Bonds
Mutual funds
ETFs
Commodities
The objective of portfolio analysis is to maximize returns while minimizing overall portfolio risk.
Diversification is a risk-management strategy that involves spreading investments across multiple assets.
Instead of investing all money in one stock, investors distribute funds across different sectors and asset classes.
Example of a diversified portfolio:
| Asset | Allocation |
|---|---|
| Stocks | 50% |
| Bonds | 20% |
| Gold | 15% |
| Real Estate | 15% |
Diversification reduces the impact of poor performance in any single investment.
Modern Portfolio Theory was developed by economist Harry Markowitz.
The theory explains how investors can construct portfolios that maximize returns for a given level of risk.
The theory emphasizes:
Diversification
Risk-return trade-off
Portfolio optimization
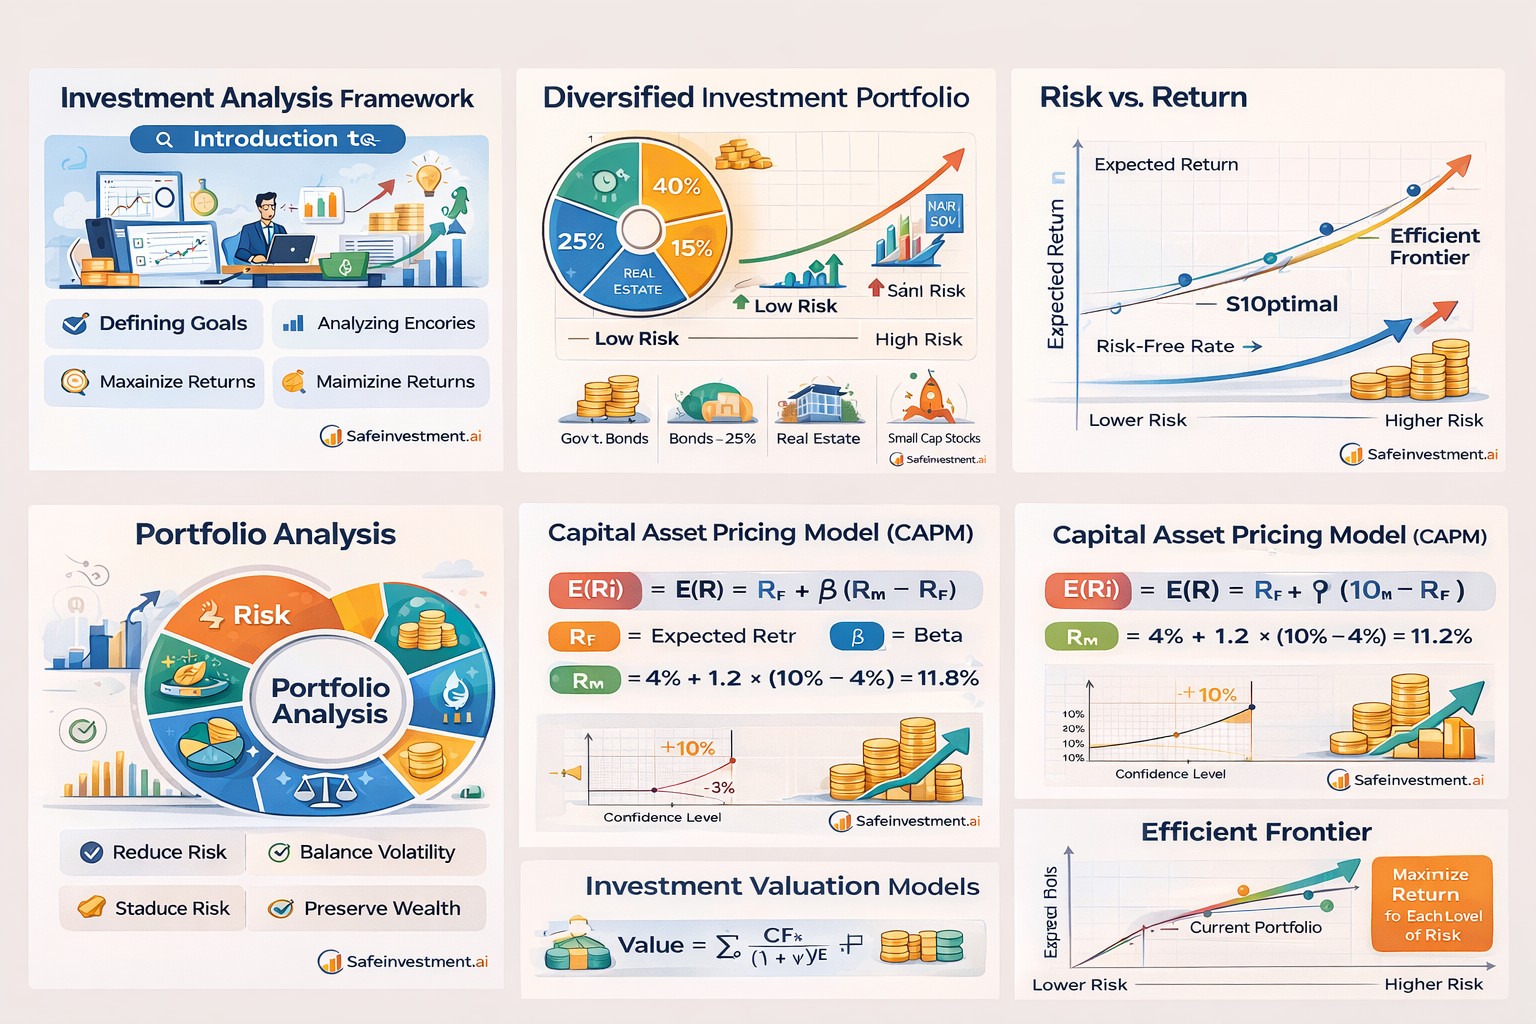
The efficient frontier represents a set of portfolios that offer the highest expected return for each level of risk.
Portfolios lying on the efficient frontier are considered optimal because they provide the best balance between risk and return.
Several statistical tools are used to measure investment risk.
Standard deviation measures how much investment returns fluctuate around the average return.
Higher standard deviation indicates higher volatility.
Example:
| Stock | Average Return | Standard Deviation |
|---|---|---|
| Stock A | 10% | 5% |
| Stock B | 10% | 20% |
Stock B is more volatile.
Beta measures how sensitive a stock is relative to market movements.
Interpretation:
Beta = 1 → moves with market
Beta > 1 → more volatile
Beta < 1 → less volatile
Example:
If the market increases by 10% and a stock has beta = 1.5, the stock may increase by 15%.
CAPM estimates the expected return of an asset based on its risk relative to the market.
Formula:
E(Ri) = Rf + β(Rm − Rf)
Where:
E(Ri) = expected return
Rf = risk-free rate
β = beta
Rm = market return
Example:
Risk-free rate = 4%
Market return = 10%
Beta = 1.2
Expected return = 4 + 1.2(10 − 4)
Expected return = 11.2%
Investors use valuation models to estimate the intrinsic value of assets.
DDM values stocks based on expected future dividends.
Formula:
Price = Dividend / (Required Return − Growth)
This model is commonly used for dividend-paying companies.
The information provided on SafeInvestment.ai is for educational and informational purposes only. The content published on this website is intended to help readers understand financial concepts such as investment analysis, stock market fundamentals, portfolio management, and financial planning.
SafeInvestment.ai does not provide financial, investment, legal, or tax advice. The information presented should not be interpreted as a recommendation to buy, sell, or hold any financial security, investment product, or financial instrument.
Financial markets involve risk, and investment decisions should be made carefully after conducting independent research or consulting with a qualified financial advisor or professional.
While efforts are made to ensure that the information provided on this website is accurate and up to date, SafeInvestment.ai makes no guarantees regarding the completeness, reliability, or accuracy of the content.
SafeInvestment.ai and its authors shall not be held responsible for any financial losses, investment decisions, or actions taken based on the information provided on this website.
By using this website, you acknowledge that you are responsible for your own financial decisions and agree to use the information for educational purposes only.